The presence of a pest in a crop is not an automatic trigger for control. Attempting to prevent all damage is usually uneconomic. Economic thresholds help to rationalise the use of pesticides and are one of the keys to profitable pest management. The development of economic thresholds requires knowledge of pests, their damage, the crop’s response to damage, and estimates of likely crop value and costs of control.
On this page:
- Nominal vs economic thresholds
- Yield based thresholds
- Quality (preventative) thresholds
- Defoliation thresholds
- Benefit:Cost ratio
- Thresholds for young larvae
Nominal versus economic thresholds
The majority of thresholds for insects in broadacre grains are nominal thresholds, where the relationship between pest density and yield loss has not been determined experimentally, but estimated, based on experience of consultants and researchers. Nominal thresholds are not overly flexible in situations when crop values and spray costs vary widely, e.g. seasonal price fluctuations.
An economic threshold (ET) is defined as: ‘the pest population likely to cause damage equal in value to the cost of control (pesticide plus application).’ Such a population is known as the ‘critical’ or ‘break even’ population. Spraying is only recommended when insect numbers exceed the ET (i.e. when the value of damage is likely to exceed the cost of control). In most instances, yield loss is the critical factor governing spray decisions, as yield loss occurs before quality is affected enough to cause downgrades. There are exceptions where the threshold is based on a loss of quality (e.g. podsucking bug damage to culinary soybeans).
Targeting only above-threshold pest populations:
- prevents negative financial returns (where the ‘cure’ costs more than the original pest damage would have)
- reduces risk of induced outbreaks of non-target pests (particularly Helicoverpa, aphids and whiteflies) caused by unnecessary pesticide application effects on beneficial populations
- reduces risk of insecticide resistance developing
Understanding how thresholds are calculated and the assumptions behind them makes them easier to use, and increases confidence in them as a useful management tool.
Yield-based ETs
Yield-based economic thresholds use measured losses from invertebrate feeding that has a direct impact on yield, where the value of the damage caused is in direct proportion to the numbers present (e.g. 1 larvae/m2 causes a certain amount of yield loss, 2 larvae/m2 causes twice as much etc.). Once research has determined the amount of damage per pest, the ET can be calculated using the following equation:
Economic threshold (pests/m2) = C ÷ (V x D)
Where
- C = cost of control including application ($/ha)
- V = crop value ($/tonne)
- D = damage per pest (t/ha for every pest/m2)
Thresholds are usually specified as the number of insects found per unit crop area (or length of row) using a specified (standard) sampling technique, and are generally expressed in pests per square metre (pests/m2). If row spacing is other than one (1) metre, convert pest counts/m to pests/m2 by dividing them by the row spacing in metres.
Below is an example of an economic threshold calculation for helicoverpa in soybeans, where the damage factor (D) at podding has been determined as being 50 kg/ha (0.05 t) for a density of one (1) larva per square metre of crop. If a crop with an estimated value (V) of $350/t is to be aerially sprayed with indoxacarb (Steward) (C = cost of control plus application is ≈ 21+12 = $33/ha), then:
| Economic threshold (larvae/m2) = | C ÷ (V x D) |
| = | 33 ÷ (350 x 0.05) |
| = | 1.9 helicoverpa larvae per m2 |
Just how far above the ET a pest population has to be before action is taken is a matter of;
- individual judgement
- the benefit:cost ratio used to make economic decisions
- confidence in sampling results
- cost of control.
While the amount of damage caused per insect is assumed to be relatively constant, both the value of the crop and the cost of control can vary significantly. Therefore a true economic threshold accommodates fluctuations in pesticide selection, pesticide prices and crop value. As a rule of thumb, the lower the cost of control, and the higher the crop value, the lower the threshold.
Quality-based (preventative) ETs
When seed quality is the critical pricing factor, preventative thresholds, rather than a yield-based threshold, should be considered. In this context, critical damage occurs when a certain quality standard (such as percentage damaged seeds) is breached, resulting in a significant crop value discount.
Because quality thresholds are usually very low, thorough monitoring for pests is essential. Inadequate sampling will very likely underestimate invertebrate numbers.
Example: In an average sized (1500 seeds/m2) crop of edible soybeans, more than 2% of seeds are damaged when green vegetable bug populations exceed 0.5 adult bugs/m2. Above 2% damaged seeds, the bonus for edible quality is lost and crop value can be downgraded by up to $400/ha, i.e. by many times the cost of control. The preventative or action threshold in edible soybeans is therefore set at 0.3 bugs/m2 to ensure the critical damage level is not reached.
Overall yield is important to consider when using quality thresholds, as a given pest population inflicts more damage in percentage terms in a lower-yielding crop (i.e. one with fewer seeds per unit area), than the same population in a larger crop with many more seeds per unit area.
Defoliation thresholds
Defoliation thresholds are a type of yield-based threshold, but are based on studies linking the percentage of defoliation with yield loss. Studies have shown that some vegetative crops are remarkably tolerant of attack.
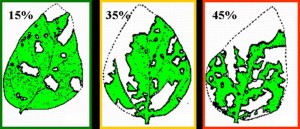
Percent defoliation of soybean leaflets attacked by Helicoverpa larvae. Note how the measured defoliation seems to be less than suggested by the observer’s eye.
Specific results from studies have shown that:
- Soybeans and mungbeans can tolerate up to 33% defoliation with no subsequent loss of yield. However, tolerable defoliation falls to 15-20% during the flowering and podding stages.
- In canola, studies have shown that from late flowering to pod-maturity – a 40% loss of foliage – caused by Diamondback moth – caused a 5% yield loss.
The crop’s status will ultimately have a large bearing on any decisions taken in these situations. The larger the crop, the less percentage defoliation occurs for a given number of leaf feeding pests. As such, rapidly growing, healthy crops are at lesser risk. Smaller, drought stressed crops not only face the risk of terminal damage, but are also more affected by sap-sucking pests, such as aphids and mites.
Varying levels of defoliation are shown in the diagram (right).
Benefit:Cost ratio
IPM programs often use a Benefit: Cost Ratio (BCR) of 1.5:1. This means that action is only taken when the value of likely damage prevented is at least 1.5 times the cost of control.
A high ratio is most feasible where the threshold is based on a very low cost of control option. For example if a spray cost $10, a ratio of 2:1 might acceptable (spending $10 to prevent $20 crop loss rather than $15 crop loss), whereas if the spray cost $50, it is less likely that growers would accept an additional $50/ha damage before taking action.
The BCR values adopted are a matter for negotiation between agronomists and their clients.
Thresholds for immature caterpillars
Since most crop damage is generally caused by the larval stages of a pest, the question is often asked about how to factor young larvae into thresholds and damage estimates. Where older larvae are detected at sub thresholds, the number of smaller larvae will have to be taken into account when assessing potential economic damage.
Thresholds often assume that larvae will complete their development if not controlled, thus wreaking the maximum possible amount of damage. However, in practice many larvae are attacked by predators, killed by disease or even just blown off the crop before they reach a damaging size.
For this reason, a decision can be made to hold off if the majority of caterpillars present are only small, particularly if large numbers of predators are present.
Ensure that monitoring occurs on a regular basis to assess the fate of these small larvae, the presence of beneficial insects and plant damage.
